When you receive your DNA Ethnicity Estimate from MyHeritage, what you see is a spinning globe animation revealing your ethnicity percentages, and a list of Genetic Groups you belong to. Behind that experience lies a complex and fascinating scientific process. As a bioinformatician on the MyHeritage Science Team, I’m excited to offer a behind-the-scenes look at how our new model — Ethnicity Estimate v2.5 — was built, and the scientific principles that make it possible.
What is an Ethnicity Estimate?
Your ethnicity estimate is not a fixed identity or a definitive label: it’s a statistical prediction based on your DNA. What we’re trying to do is understand, from the small variations in your genome, where your ancestors may have come from. Humans are 99.9% genetically identical, but it’s that remaining 0.1% that holds the clues to our origins. Within it are patterns that differ between populations, shaped over thousands of years of migration, isolation, and intermixing.
Our job is to identify those patterns and use them to estimate the proportion of your DNA that matches known populations around the world.

How DNA inheritance shapes the estimate
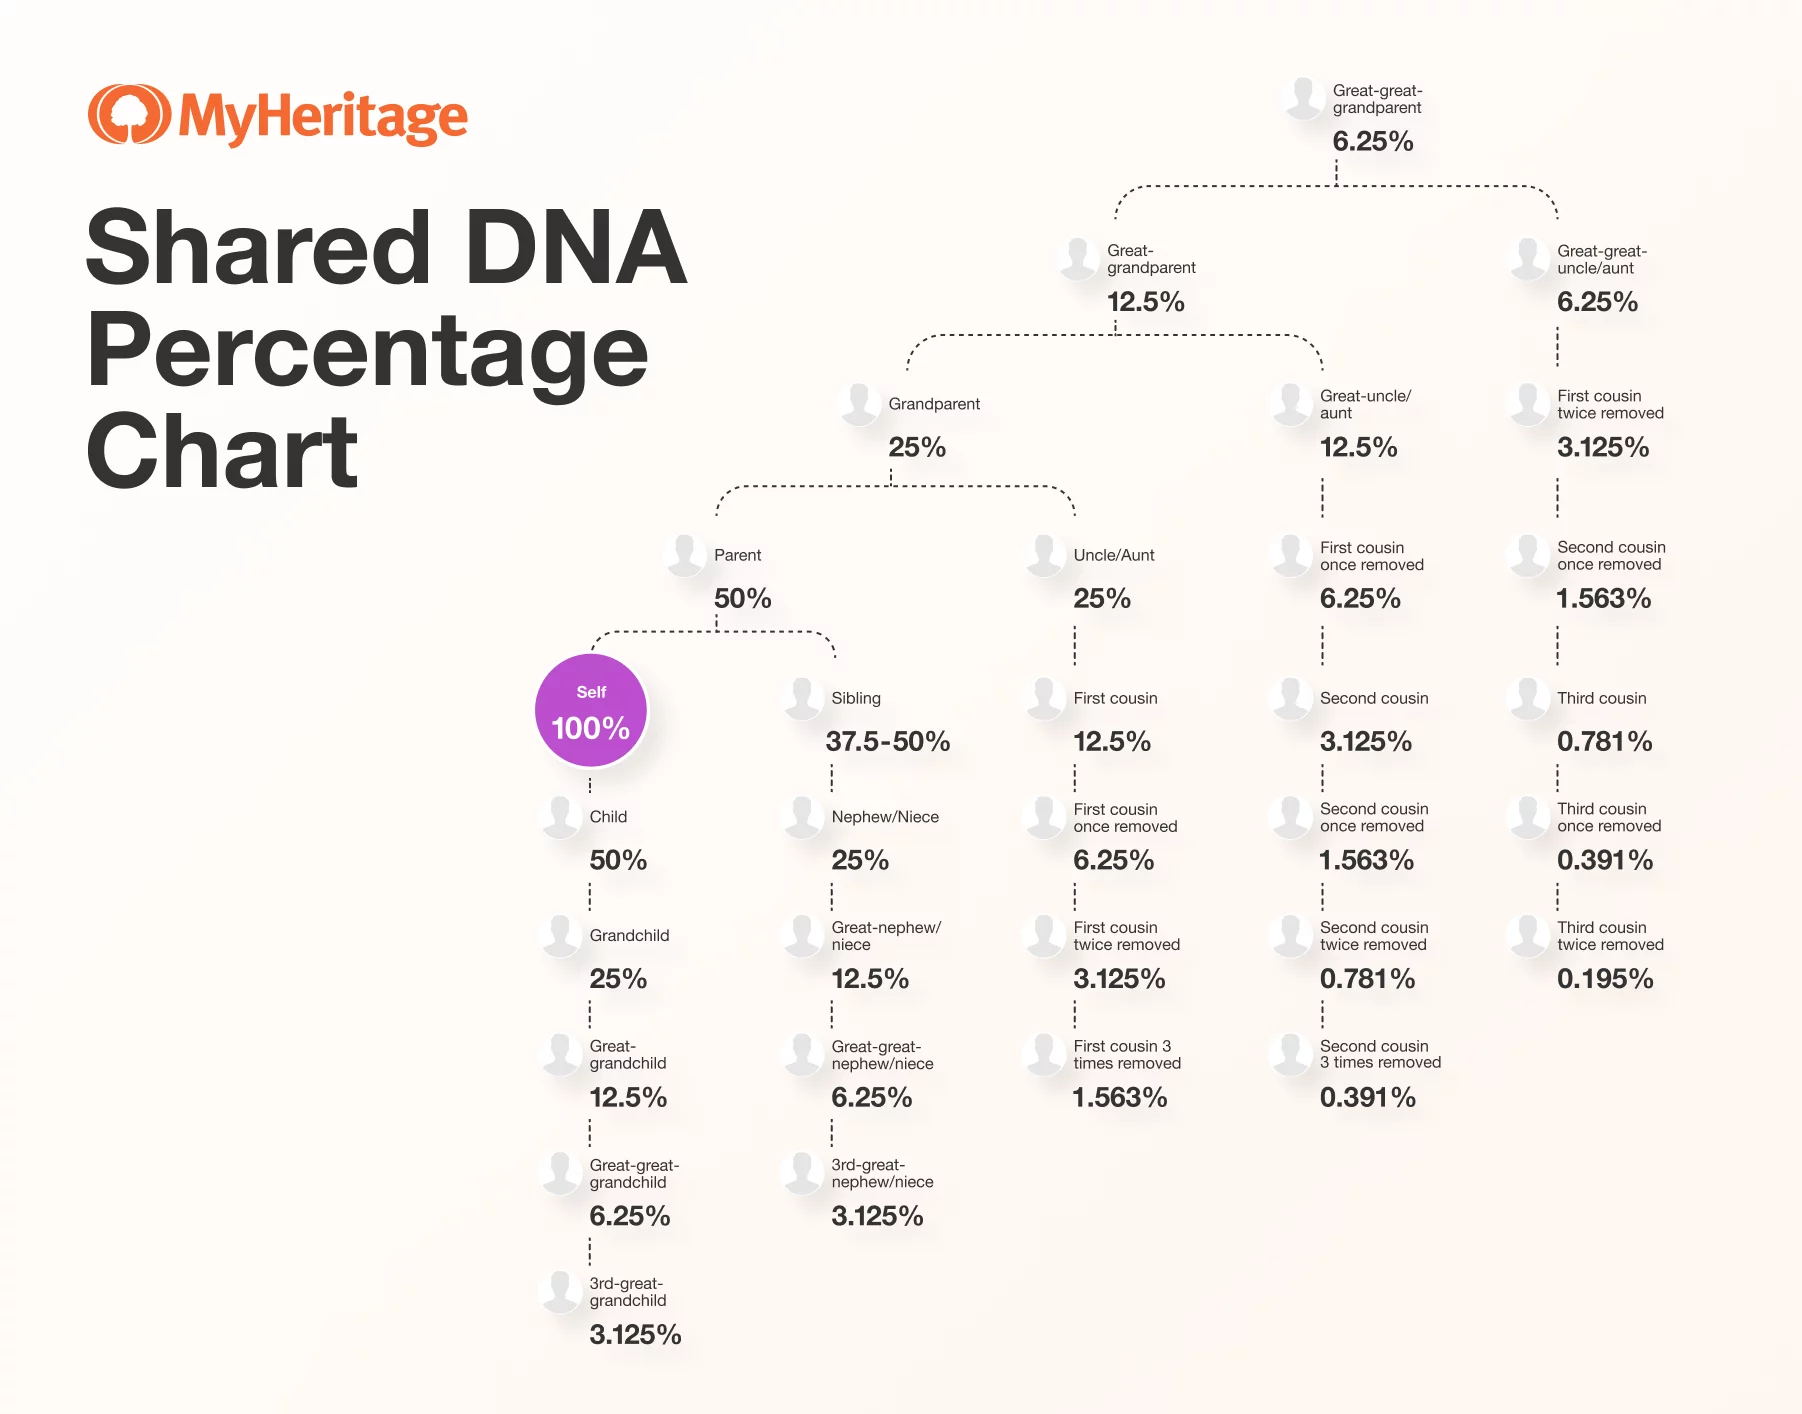
To make sense of these patterns, it helps to understand how DNA is passed down through generations. Each of us inherits 50% of our DNA from each parent. From each grandparent, we inherit roughly 25%, and from each great-grandparent, about 12.5%. As we continue backward through the generations, the proportions become smaller and less predictable. On average, we might inherit only a small fragment of DNA from a specific ancestor several generations back, and in some cases, we might not inherit any detectable DNA from a particular line at all.

This happens because of a process called recombination. During reproduction, DNA is shuffled and recombined before it is passed on to the next generation. This means that each person’s genome becomes a patchwork of segments from many ancestors, but not in equal measure. Some ancestors contribute more DNA than others, and some contribute none. Over time, certain segments are lost, and others are retained.
As a result, your DNA is essentially a mosaic: small pieces from many different ancestors. This mosaic structure is central to how ethnicity estimates work. We analyze these small fragments to identify patterns that match reference populations. Because we rely on what is physically present in your DNA, there may be ancestors who appear in your genealogical tree but are not reflected in your ethnicity estimate. Conversely, you might see ethnicities you didn’t expect — because DNA has preserved a segment from an ancestor whose story has been forgotten.
Understanding the nature of inheritance helps explain why ethnicity results can be both fascinating and surprising. The science doesn’t attempt to reconstruct your entire family tree — it looks at the genetic footprints your ancestors left behind.
How we detect ethnicity: global vs. local ancestry
In earlier models, we used a method called global ancestry prediction. This approach compares your overall DNA to reference populations and estimates your ethnic makeup as a whole. It looks at the frequencies of certain genetic variants that are more common in one population than another. By aggregating those patterns across the entire genome, we can estimate how much of your DNA resembles that of different populations. While it works well for identifying broad ancestral regions, it struggles with the finer distinctions between genetically similar populations.
That’s why, in our newest model, we’ve adopted a method called local ancestry inference. Instead of looking at your genome as a single unit, we break it down into small, overlapping regions we call windows. Each window is then analyzed separately to determine its most likely ancestral origin. This approach mimics how DNA is inherited in segments, allowing us to trace specific pieces of your genome back to specific populations.
Local ancestry inference is much more complex. The genetic differences between some populations — especially those that are geographically close or historically connected — can be extremely subtle. To detect them, we need a large and diverse reference panel, finely tuned algorithms, and high computational power. But the result is worth it: greater resolution, improved accuracy, and the ability to detect ancestral contributions that older methods might miss. With local ancestry inference, we can offer more precise ethnicity estimates and identify populations that were previously indistinguishable using global methods.
Building the reference panel
At the heart of our model is something called a reference panel. This is a curated set of DNA samples from individuals whose families have lived in the same region for generations. These individuals serve as the genetic benchmarks for each population.
MyHeritage has a unique advantage in building this panel: we combine DNA data from millions of users with one of the largest collections of family trees in the world. This allows us to confirm not just the genetic profile of a user, but also their genealogical background. We look for users whose grandparents and great-grandparents were all born in the same region, and whose DNA clusters closely with others from that region. This helps us ensure the samples we include are as representative and reliable as possible.
We also strive for balance. Even if we have more DNA samples from one part of the world, we don’t let that skew the panel. Instead, we aim to represent a wide variety of global populations as evenly as we can.
How the model works
Once we have our reference panel, we train a machine learning model to recognize patterns in the DNA. When a new user’s DNA is analyzed, we break it into segments and compare each one to the panel. The model assigns each segment to the population it most likely came from. From there, we calculate the percentages that appear in your final ethnicity estimate.
This process happens at a massive scale. We’re working with millions of genomes, billions of data points, and constantly updating our algorithms to keep up with the latest scientific research. Our new model, v2.5, uses far more data, more sophisticated machine learning techniques, and a much larger reference panel than before.

Going deeper with Genetic Groups
While ethnicity estimates offer a population-level view of your heritage, Genetic Groups provide a more granular, community-level perspective. This feature, which complements the Ethnicity Estimate, identifies specific regional and cultural clusters by analyzing shared DNA segments among users.
To build Genetic Groups, we examine the DNA of millions of users and identify patterns of shared segments across extended networks of matches. When a large group of individuals share DNA and also have family histories tied to the same geographic region, we classify them into a Genetic Group. This approach helps us detect subpopulations that may not be genetically distinct enough to qualify as separate ethnicities but still represent meaningful historical and cultural communities.
With over 2,000 Genetic Groups currently available, this layer of analysis adds richness and depth to your DNA results.
Why it matters
All of this science serves a single purpose: to help you understand more about where you come from. Our goal is to give you results that are as accurate, meaningful, and personal as possible. With Ethnicity Estimate v2.5, we’re able to offer 79 different ethnicities, including newly defined ones like Armenian, Persian, and Punjabi, and a more detailed breakdown of Jewish and European populations than ever before.
Science is always evolving, and so are our tools. As we continue to refine our models and incorporate more data, we look forward to uncovering even more about the intricate story written in your DNA.
This article was adapted from a webinar given by Ethel Vol on Legacy Family Tree Webinars on March 18, 2025. The webinar contains plenty of additional fascinating information and examples, so if you’d like to dive deeper into this topic, check it out here: Explore Your Ethnic Roots with MyHeritage’s Improved DNA Ethnicity Model, v2.5
Got more questions about Ethnicity Estimate v2.5? Check out MyHeritage’s Ethnicity Estimate v2.5: Your Questions Answered.


