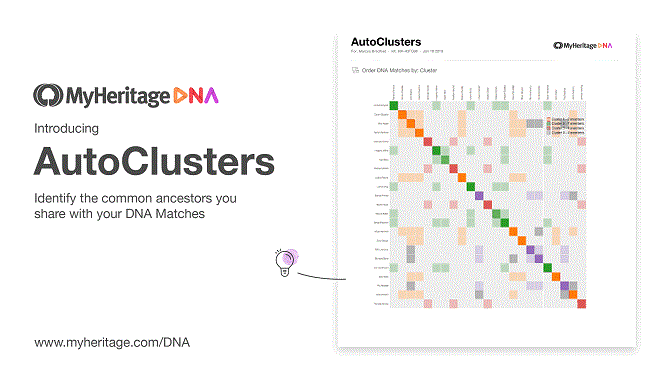
AutoClusters is a genetic genealogy tool that groups together DNA Matches that likely descend from common ancestors in a compelling visual chart. This easy-to-use tool, developed in collaboration with Evert-Jan Blom of GeneticAffairs.com, helps you explore your DNA Matches more efficiently in groups rather than as numerous individuals, and gain insights about branches in your family tree.
In recent years, millions of people have turned to DNA testing to gain insights into their family history and to discover new relatives. While DNA testing does provide answers, typical DNA Matching results include only estimated relationships, such as first to third cousin, with no indication of the exact relationship path. In some cases, MyHeritage is able to use historical records and family trees to suggest the exact relationship path (see Theory of Family Relativity™) but this is not always possible. That’s where the AutoClusters tool comes in handy.
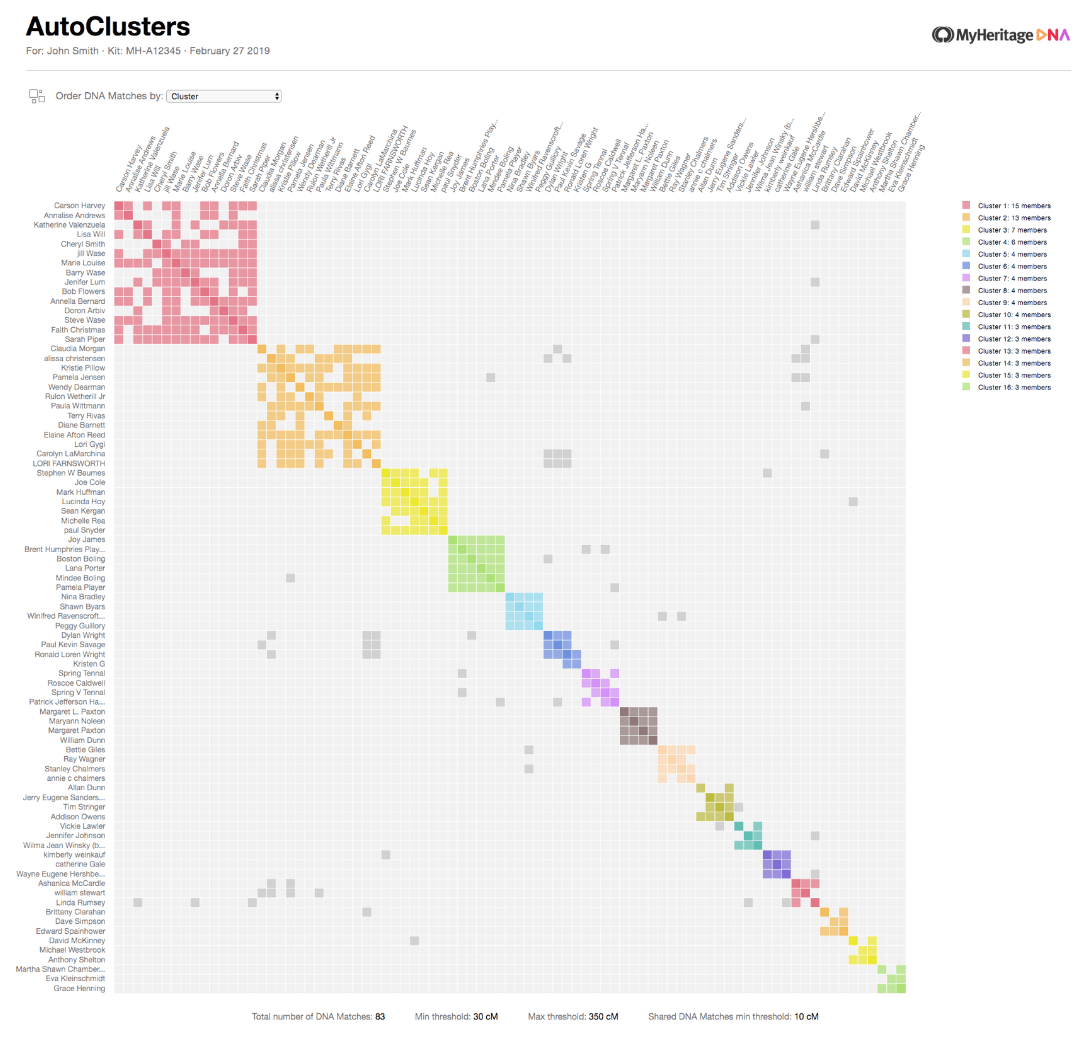
AutoClusters organizes your MyHeritage DNA Matches into clusters of matches that likely descended from common ancestors. By grouping together DNA Matches who likely belong to the same branch and have a common ancestor, AutoClusters can help shed light on the relationship paths that connect you and your matches. By reviewing family trees of clustered matches, users can piece together the entire branch. Clusters are color-coded for convenience and are presented in a powerful visual chart as well as in list format.
More about the AutoClusters chart
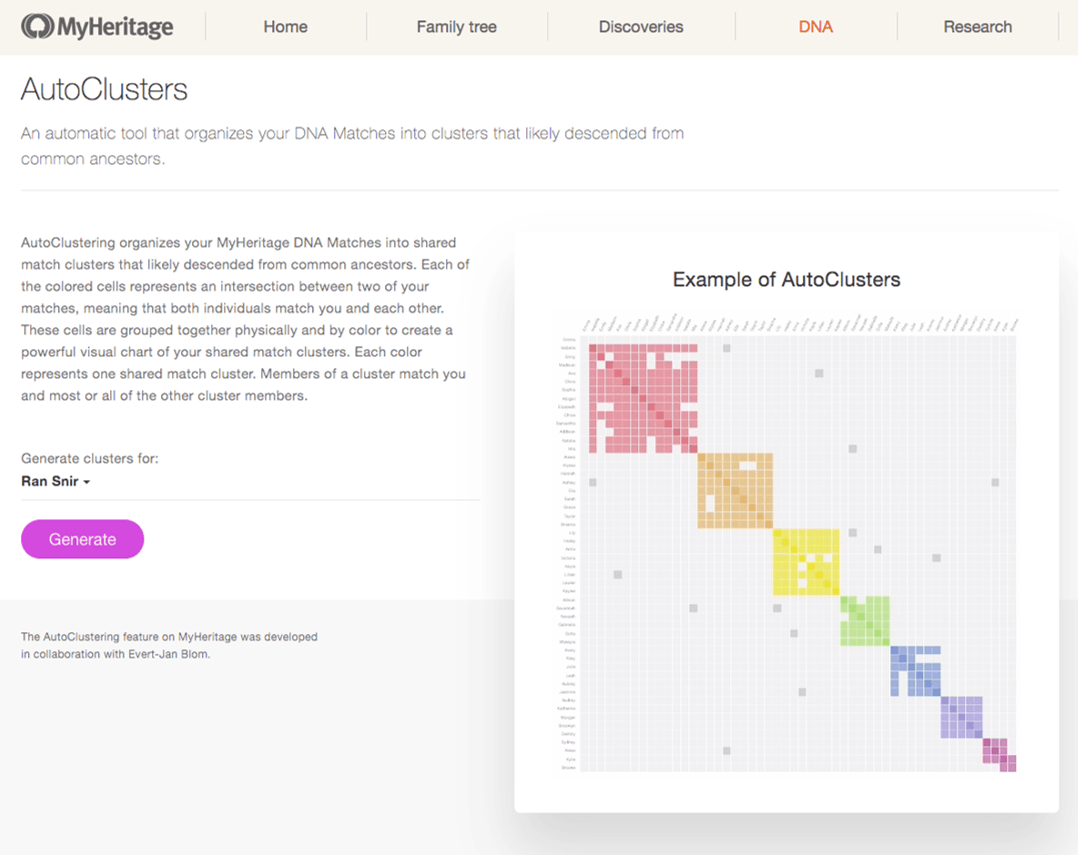
Each of the colored cells in a cluster represents an intersection between two of your matches, meaning that both individuals match each other (in addition to matching you). These cells are grouped together physically and by color to create a powerful visual chart of your shared match clusters.
Each color represents one shared match cluster. Members of a cluster match you and most or all of the other cluster members. Every individual in a cluster will likely be on the same ancestral line, although the most recent common ancestor between any of the matches and between you and any match may vary. The generational level of the clusters may vary as well. One may be your paternal grandmother’s branch, and another may be your paternal great-grandfather’s branch.
You may see several gray cells that do not belong to any color-grouped cluster. They sometimes represent a shared match where one of the two cousins is too closely related to you to belong to just one cluster. A bunch of adjacent gray cells can be an indication that two clusters are related to each other.
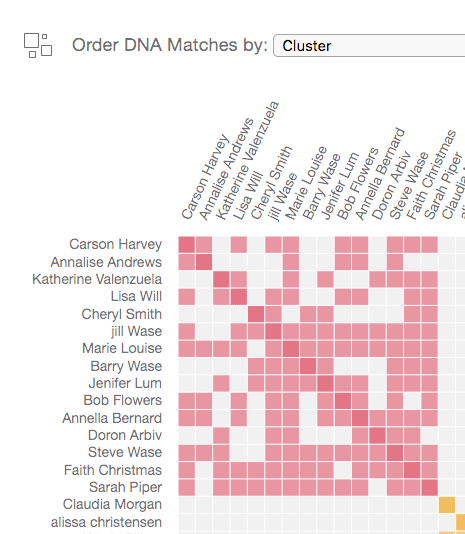
Below the chart, all clusters are displayed in list format.
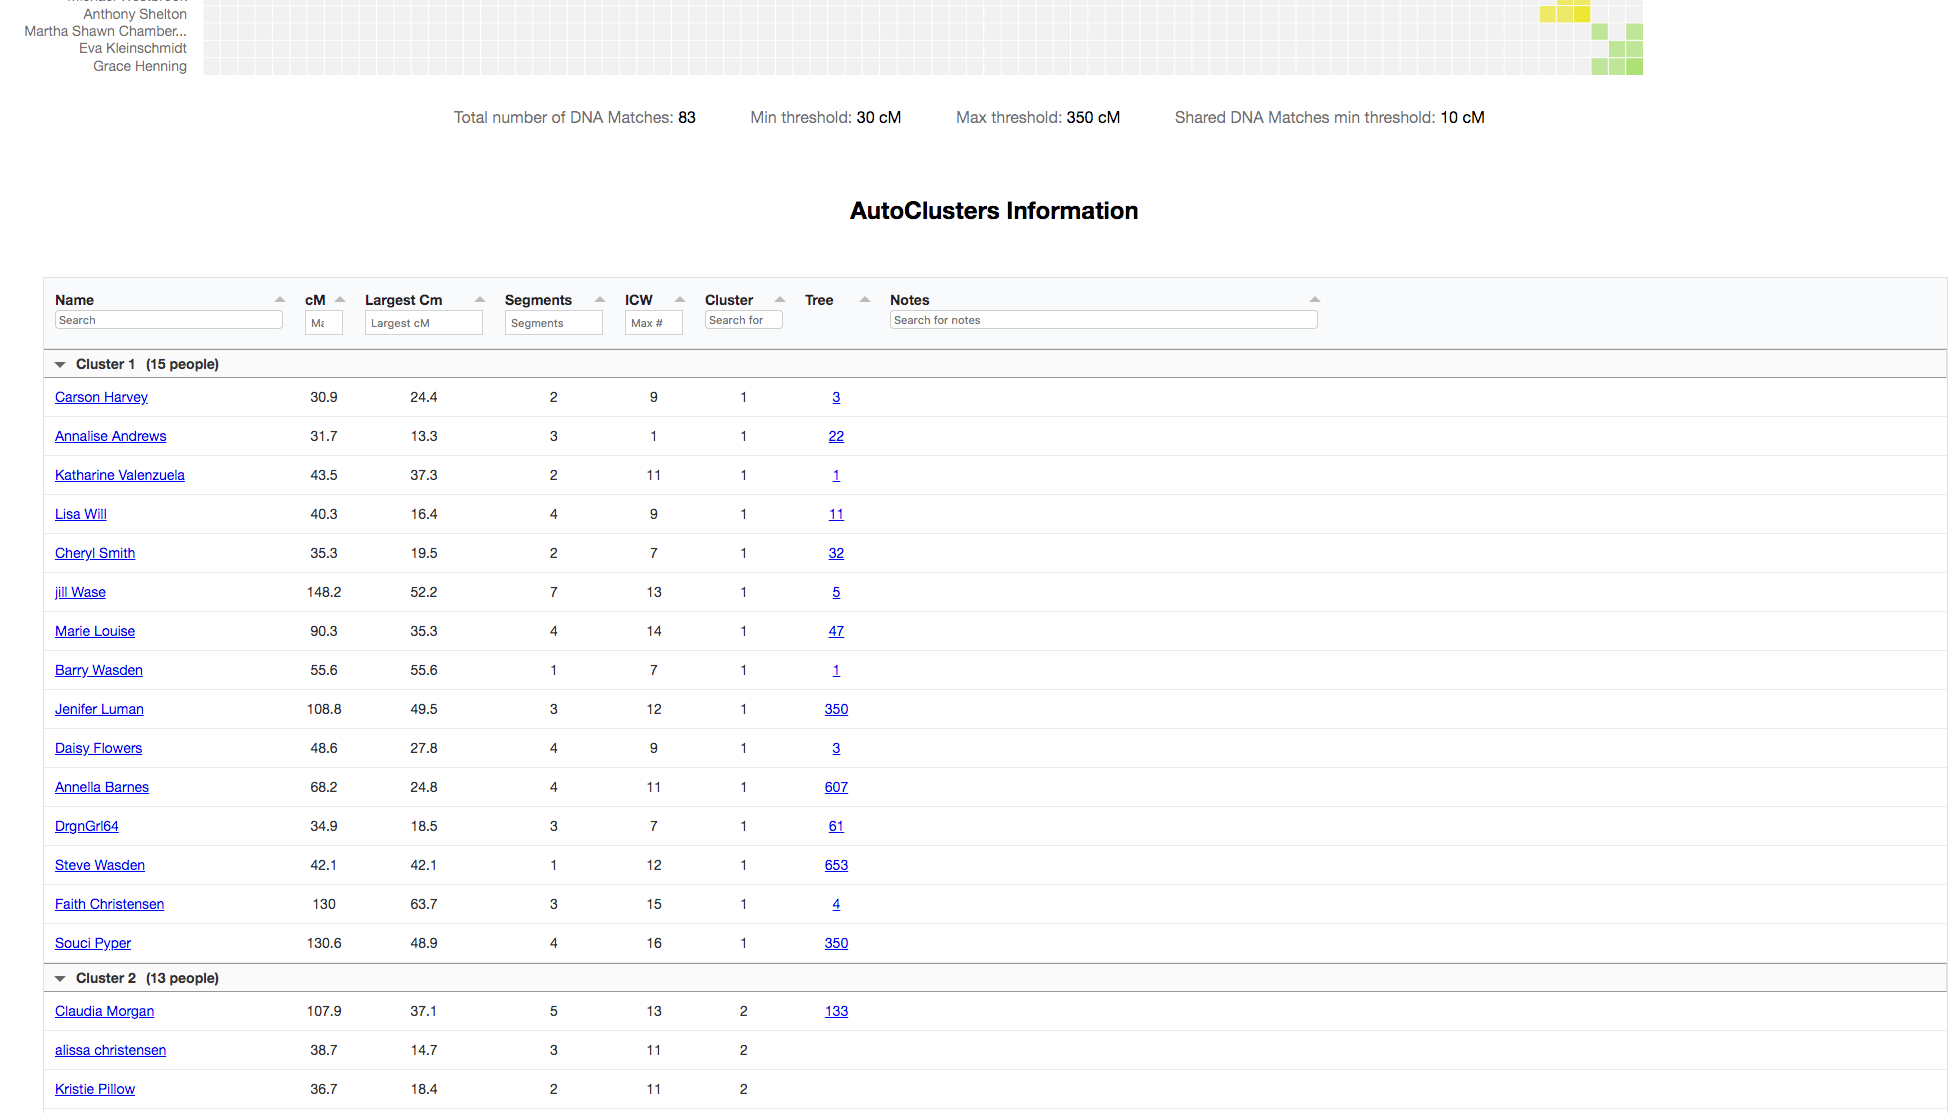
In the list, for each cluster, you can conveniently view the family trees of your DNA Matches or access each DNA Match in order to contact that person. In a future version, we plan to include for each cluster the shared ancestral surnames and ancestral places that are most common to the cluster members. This can provide more clues as to the identity of the common ancestors of the cluster.
You can explore clusters of interest by viewing the family trees of its members and trying to identify the common ancestors. This can lead to new revelations about some of your own ancestors that you are currently unfamiliar with.
Accessing AutoClusters
Access AutoClusters by clicking on “DNA Tools” in the DNA menu.
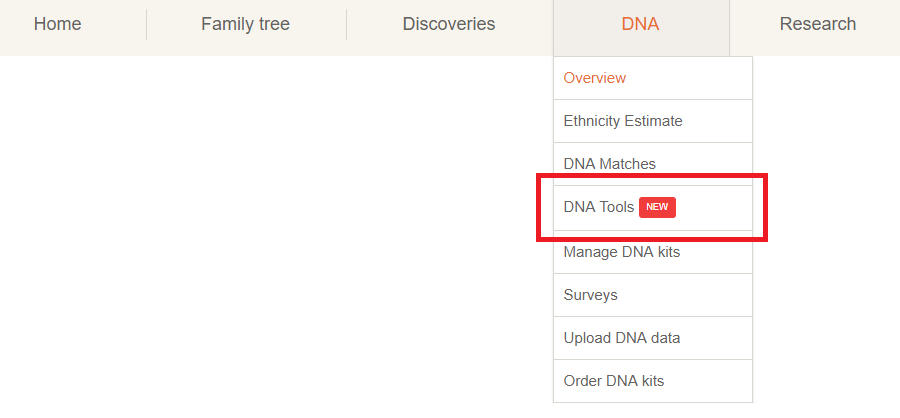
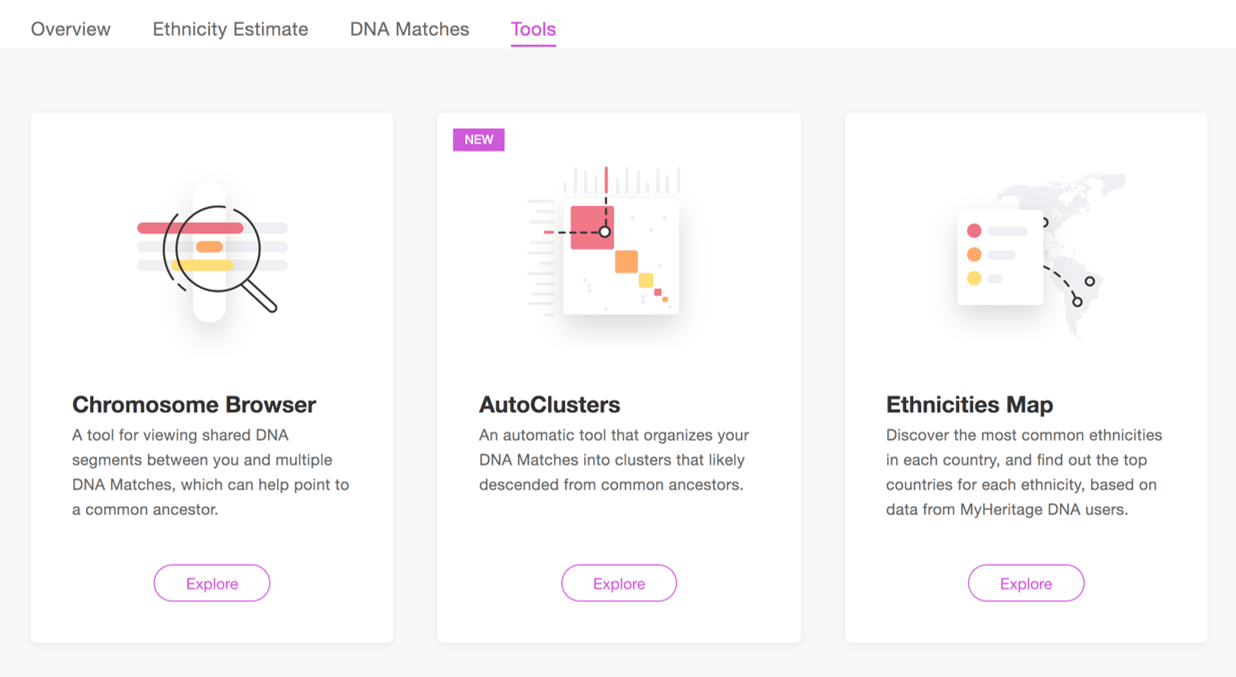
The Tools page is the place where we bring together advanced tools such as the Chromosome Browser and AutoClusters. This page is also accessible from the “Tools” tab next to your DNA Matches and Ethnicity Estimate.
On the Tools page, click “Explore” on the AutoClusters card.
You’ll arrive at the AutoClusters page. Click “Generate” to create your AutoClusters. If you are managing DNA kits for more than one person, first select which DNA kit you want to generate AutoClusters for.
Depending on user demand, generating AutoClusters can take anywhere from a few minutes to several hours.
Once we generate your clusters and they are ready for viewing, you will receive an email with an attached zip file with your clusters. This is the implementation for our initial release. In the future, we are planning to embed the clusters inside the MyHeritage user interface and integrate them more tightly with your matches.
In the email, the zip file will include three files: an HTML file that contains a visual chart of the AutoClusters analysis, a CSV file that contains a spreadsheet version of the AutoClusters analysis, and a ReadMe.pdf file with some helpful information on AutoClusters that also describes the parameters we selected automatically for generating it.
For optimal viewing, save the files to your hard drive, extract the contents, and then open them.
Note that you can currently generate only one AutoClusters analysis per day for each DNA kit that you manage.
Settings used for the AutoClusters analysis
To generate your AutoClusters, we analyze your highest-quality matches and divide them up into the color-coded clusters. We automatically select optimal threshold parameters (such as minimum and maximum shared DNA in cM, and minimum shared DNA for shared matches) in order to yield the best clusters for your specific DNA kit.
We’ll let you know the parameters we selected by listing them in the HTML file and in the ReadMe.pdf file.
Conclusion
The AutoClusters tool uses cutting-edge technology to make DNA Matching even more useful. It helps you explore your DNA Matches more efficiently in groups rather than as individuals, and determine common ancestors with your DNA Matches. It is based purely on DNA results without involving family trees or records, and it augments the Theory of Family Relativity™ feature.
