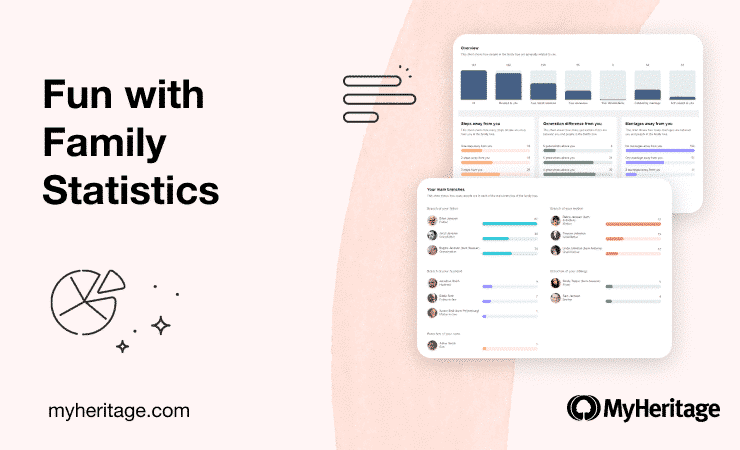
The Family Statistics feature on MyHeritage offers a new and unique way to view your family’s history. It can reveal fascinating insights about trends in your family: average lifespan, childbearing ages, marriages and divorces, migration patterns, and more.
Ready to see your family in a whole new light? Log in to your MyHeritage account, hover your mouse over the “Home” tab in the navigation bar of the MyHeritage website and select “Family statistics.”

Overview
On the Overview page, you’ll see three pie charts representing a breakdown of the genders of your family members, how many family members are living vs. how many deceased, and relationship statuses.

Below, you’ll find word clouds showing the most common names in your family: common last names, common first names for males, and common first names for females. The more common the name, the larger it will appear in the word cloud.
Relationships
The Relationships page displays 6 charts that provide a deeper understanding of how the people in your family tree are related to you.

The General chart at the top of the page displays subsets of people in your family tree based on their relationship to you, and counts the number of people in each one. For example, “All” includes all people in the tree; “Related to you” includes the subset of people who actually have a relationship path connecting you; “Your blood relatives” includes everyone in the tree with whom you share a common ancestor, and so on. Empty subsets will not be shown, so if, for example, you do not have any descendants, the corresponding subset “Your descendants” will not appear in the chart.
Next, you’ll find the following 3 charts:

“Steps away from you” indicates how many “hops” exist between you and another individual in the tree, ranked in order from the fewest number of steps to the greatest. Your closest relatives are one step away from you and include your parents, siblings, spouse(s), and children. Those who are two steps away from you include grandparents, uncles and aunts, nieces and nephews, parents-in-law and siblings-in-law, step-parents, and so on. The maximum number of steps in the chart is 10; if you have individuals in the family tree who are more than 10 steps away from you, they will be included in another entry labeled 10+.
“Generation difference from you” indicates the generation gap between you and your relatives. Your generation includes your siblings, spouse(s), cousins, second cousins, their spouses, and so on. This chart is organized from the greatest number of generations away from you to the fewest. If your family tree dates back more than 7 generations, the maximum number listed will be 7+ generations above you.
“Marriages away from you” indicates how many marriages make up the relationship path between you and your relatives. Individuals in the “Related to you without marriage” list are in fact your blood relatives. In the example above, the individual in question has 98 blood relatives in the family tree.
Further down the Relationships page is a section that displays the main branches of your family tree: those of your parents (including biological, adoptive, and foster parents, if applicable), grandparents, spouses, siblings, and children. For each branch, the number of individuals is displayed, and you can click any branch to explore those individuals in List view.
In the example below, for the user Laura Janssen, in addition to the branch of Laura’s father, Brian Janssen, we also see sub-branches for her paternal grandfather, Jozef, and her paternal grandmother, Beppie.

Hover over any branch or sub-branch to see the percentage of individuals in the tree who belong to that branch of the family. You can click on any branch to view a list of all the individuals in this branch, i.e., all people who are related to you through this relative.
The last chart on the Relationships page shows a breakdown of your blood relatives – the people in the family tree who share a common ancestor with you. Relatives in this chart are grouped according to relationship type, for example, great-grandparents or second cousins.

Clicking on any subset (bar) in the chart will open a new window that displays the corresponding individuals in List view of your family tree.
<Places
On the Places page, you’ll find three maps: one that shows the countries where your family members were born, one that shows where they died, and one that shows where they have lived. These maps can paint an interesting picture of the migration patterns of your family.


For an even more thorough overview of your ancestral places, check out PedigreeMap™: an interactive map that displays where important events in your family took place, which you can filter by country or by person. You can find it under “More” in the Family tree tab in the navigation bar. Click here to learn more about PedigreeMap™.
Ages
On the Ages page, you’ll see a chart that illustrates the age distribution among members of your family, alongside the oldest and youngest living members of your family. Clicking “Top 10” will reveal the top 10 males and females in each category.

This page also provides insights about the average life expectancy in your family and displays the individuals with the longest and shortest lifespan. Throughout Family Statistics, some charts will have an X in the upper right corner, such as “Lived the least” in the example below. If you don’t want to see a particular chart, click the X to hide it.

Births
On this page, you’ll find a chart depicting how many people in your family were born in each month of the year and during each sign of the zodiac. You’ll also discover the number of family members who were born in each century and each decade of the 20th and 21st centuries.

Marriage
On the Marriage page, you’ll find fascinating statistics about the marriages in your family. On the top row, you’ll see the average number of marriages among males and females in your family, who was married the most times, and when people in your family were married. (If you don’t wish to display the middle chart, you can hide it by clicking the X on the top right corner.)
In the second row, you’ll learn the average age of getting hitched in your family, and who got married at the youngest and most advanced ages.

In the third row, you’ll discover how long marriages tend to last in your family, who had the longest marriages, and who had the shortest. (You can hide the latter by clicking the X at the top right corner if you’d rather not see it.)
On the bottom row, you’ll find the average age difference between spouses in your family, as well as the family members with the largest age differences between partners.

Children
On the Children page, you’ll learn the average number of children per nuclear family, which family had the most children, and which people (male and female) had the most children.

In the next row, you’ll discover the average age of having children among your relatives, as well as the oldest and youngest of your relatives to have a child.

In the third row, you’ll find the average age difference between siblings, and the siblings in your family with the largest and smallest age differences.

Divorces
On the Divorces page, you’ll find out how many divorces have taken place in your family, which of your relatives divorced the most, and who had the longest marriage ending in divorce.

In the second row, you’ll find the average ages of your relatives when they divorced, and the oldest and youngest family members to get divorced.
If you don’t want to see any of these statistics, you can click the X on the upper right corner of any of the charts.

What you can learn
Looking at these statistics can teach you a lot about your family. Is there longevity in your genes? Are strong, long-lived marriages common in your family, or were there many divorces? Is there a disproportionate number of Capricorns? All these can provide insights — sometimes solemn, sometimes fun — into the lives of your ancestors and help you understand more about who you are today.


